Lens features a comprehensive toolset that allows administrators to review session telemetry and understand performance issues. One of these tools is the Session Analyser.
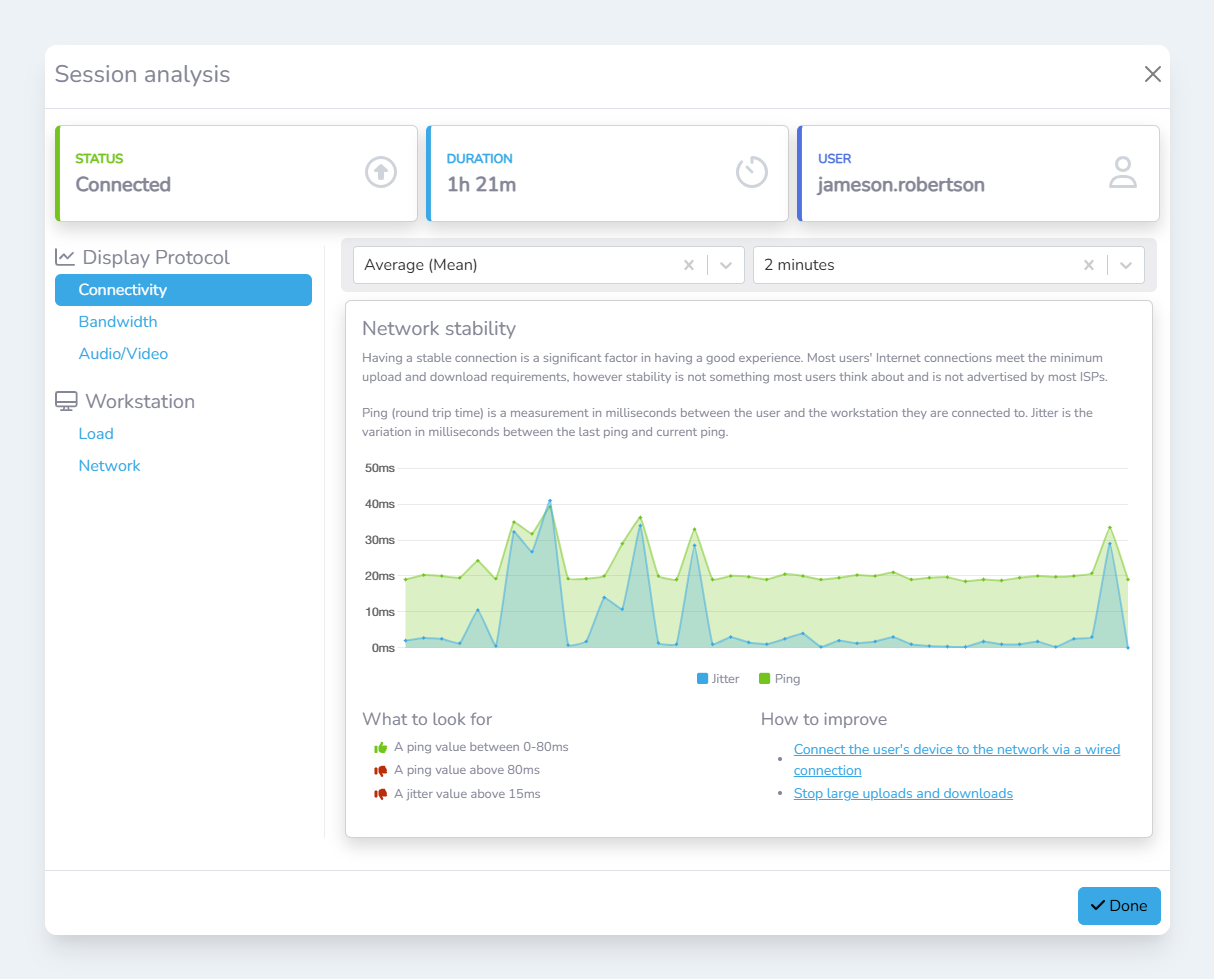
The session analyser presents a curated set of metrics, grouped by relevance, with tips on how to spot issues, and how to improve the user experience.
Opening the session analyser
-
Navigate to either the ‘Active Sessions’ page or ‘History’ page
-
Select the session you would like to analyse:
-
In table view, select the
Analyselink in theActionscolumn -
In the tile view, click the session tile
-
Granularity
Lens collects session telemetry every 30 seconds. These data points are then stored for a limited time for analysis later. See ‘Data retention’ for more information on how long this data is stored for.
Lens will attempt to automatically choose the best time interval to average the data points, based on the total data point count. Users can easily change this in the session analyser to see more, or less detail.
The aggregation method can also be changed, to enable users to look for anomalies and other issues. Currently, the supported methods are:
-
Mean
-
Max
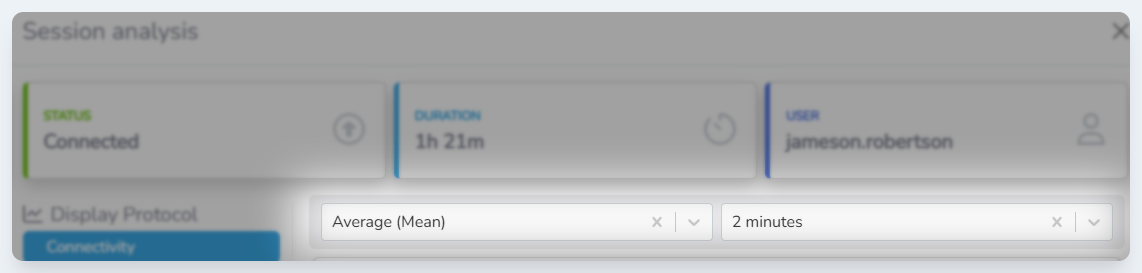
Aggregation Method and Aggregation time options in the Session Analyser