New features and improvements
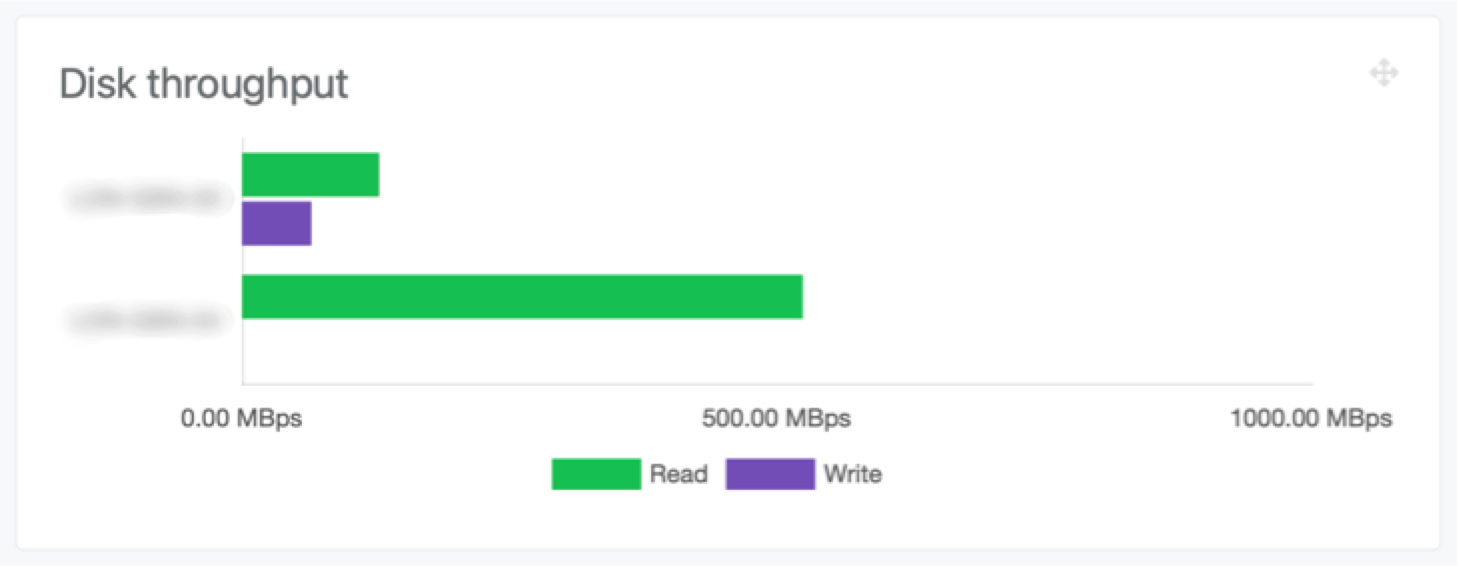
Disk IO monitoring
Whilst it has been possible to monitor the amount of network traffic going to each node in a cluster, it’s was not possible to see if this was read throughput or write throughput. With the 2.3 updates for the NAS dashboard and agent, you can now easily see read and write throughput going to the raw storage.

Improved storage enclosure monitoring
The 7fivefive NAS dashboard has always monitored the health of RAID volumes and physical disks. In this update we have added support for storage enclosure health monitoring. The dashboard will now show alerts for enclosure level events for example if a fan in a JBOD enclosure fails.
New terminal tool
The NAS dashboard is the central utility that is used to monitor and control the 7fivefive NAS cluster, but sometimes administrators may need to perform tasks that need to be done on a node-per-node basis. For this reason we have created a tool dedicated for these tasks. Simply named the ‘7fivefive NAS admin tool’ it allows administrators to SSH into a node and access an easy to use interface. For more information on the tool, see this page.
Improved web server
We’ve moved to a new web server under the hood for both the NAS agent and NAS dashboard. This provides a greater level of stability for both components.
Bug fixes
Numerous bug fixes have been addressed in this release, some of which are:
-
Operations not being marked as complete when a rebuild or copyback process finishes when the physical disk is a global hot spare
-
Diffie–Hellman key not generated when agent or dashboard is installed
-
An error occurs when trying to shutdown cluster with iDRAC via startup/shutdown tool
-
‘Other’ virtual disk is listed multiple times on node storage page
-
An error occurs when trying to clear all events
-
Fixed an issue that caused the NAS agent database to deadlock
-
Fixed issue that caused file descriptors not to close correctly when running processes
-
Fixed issue that caused AWS LUNs to not be detected
