The user insights page was designed to display data on how the Lens system is being used and to provide crucial insights for tuning other Lens features, such as workstation scheduling.
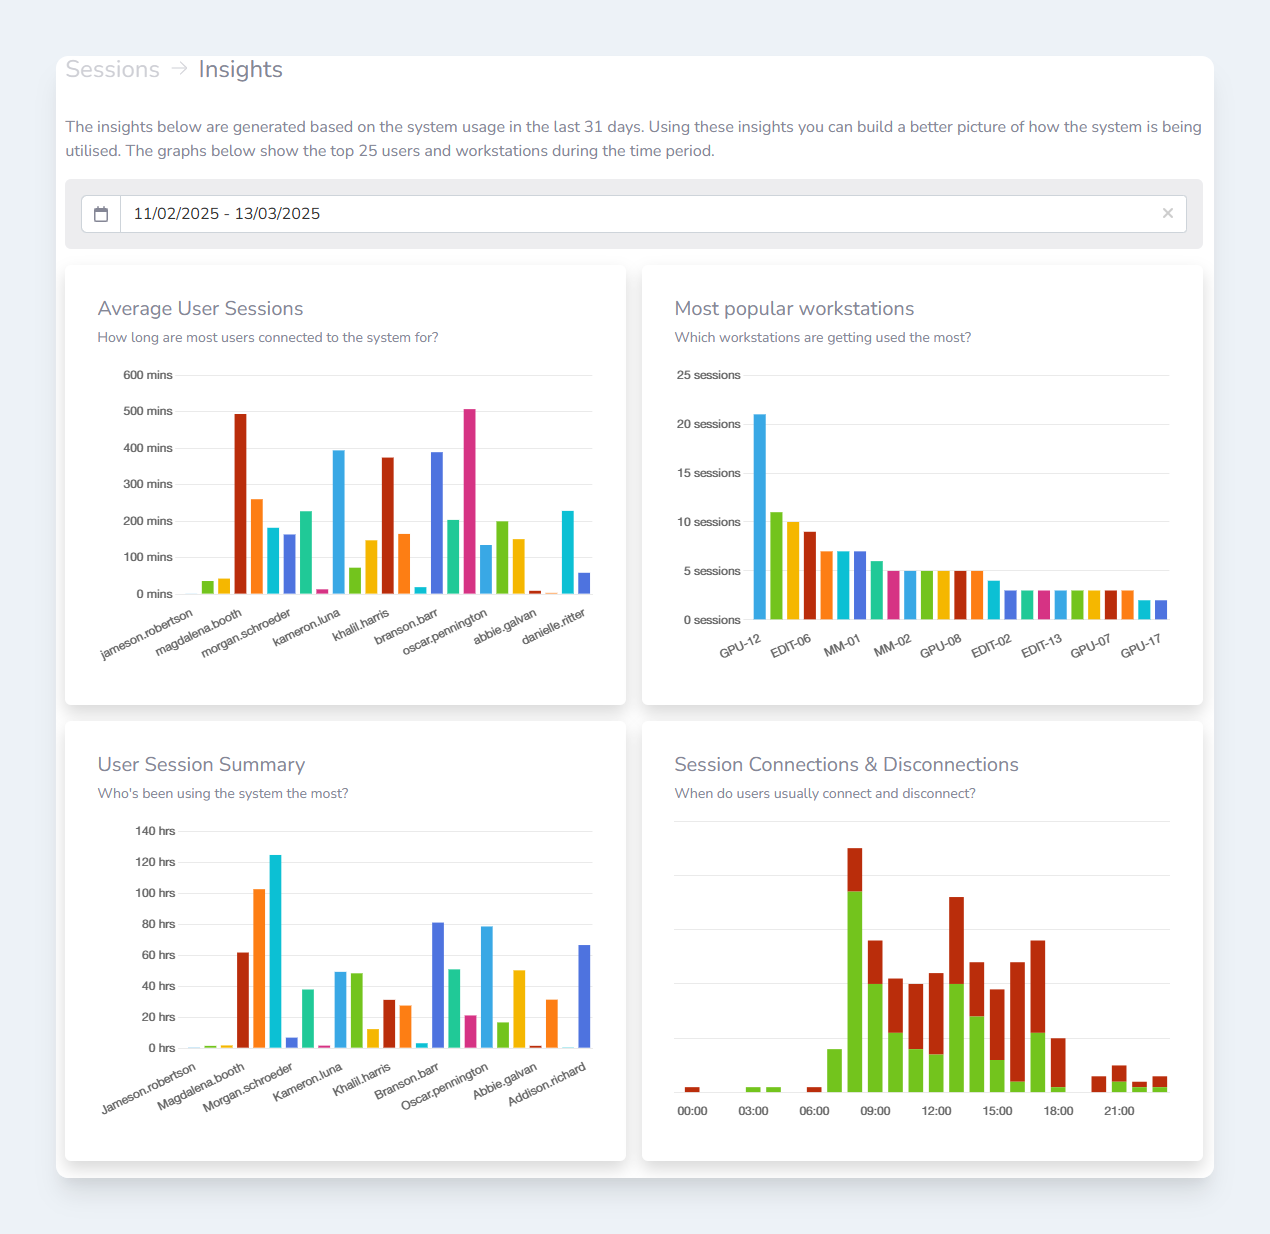
Insights page
Widgets
Average User Sessions
This graph shows on average how long users are in session for.
Most popular workstations
This graph shows which workstations are in use most often. This data can be used to understand if more workstations of a specific type need to be provisioned.
User Session Summary
This graph shows which users are using the system the most. This data can be useful when planning workstation capacity.
Session Connections & Disconnections
This graph shows a breakdown of when users connect to the system and when the disconnect. This data is useful for tuning the workstation scheduler.