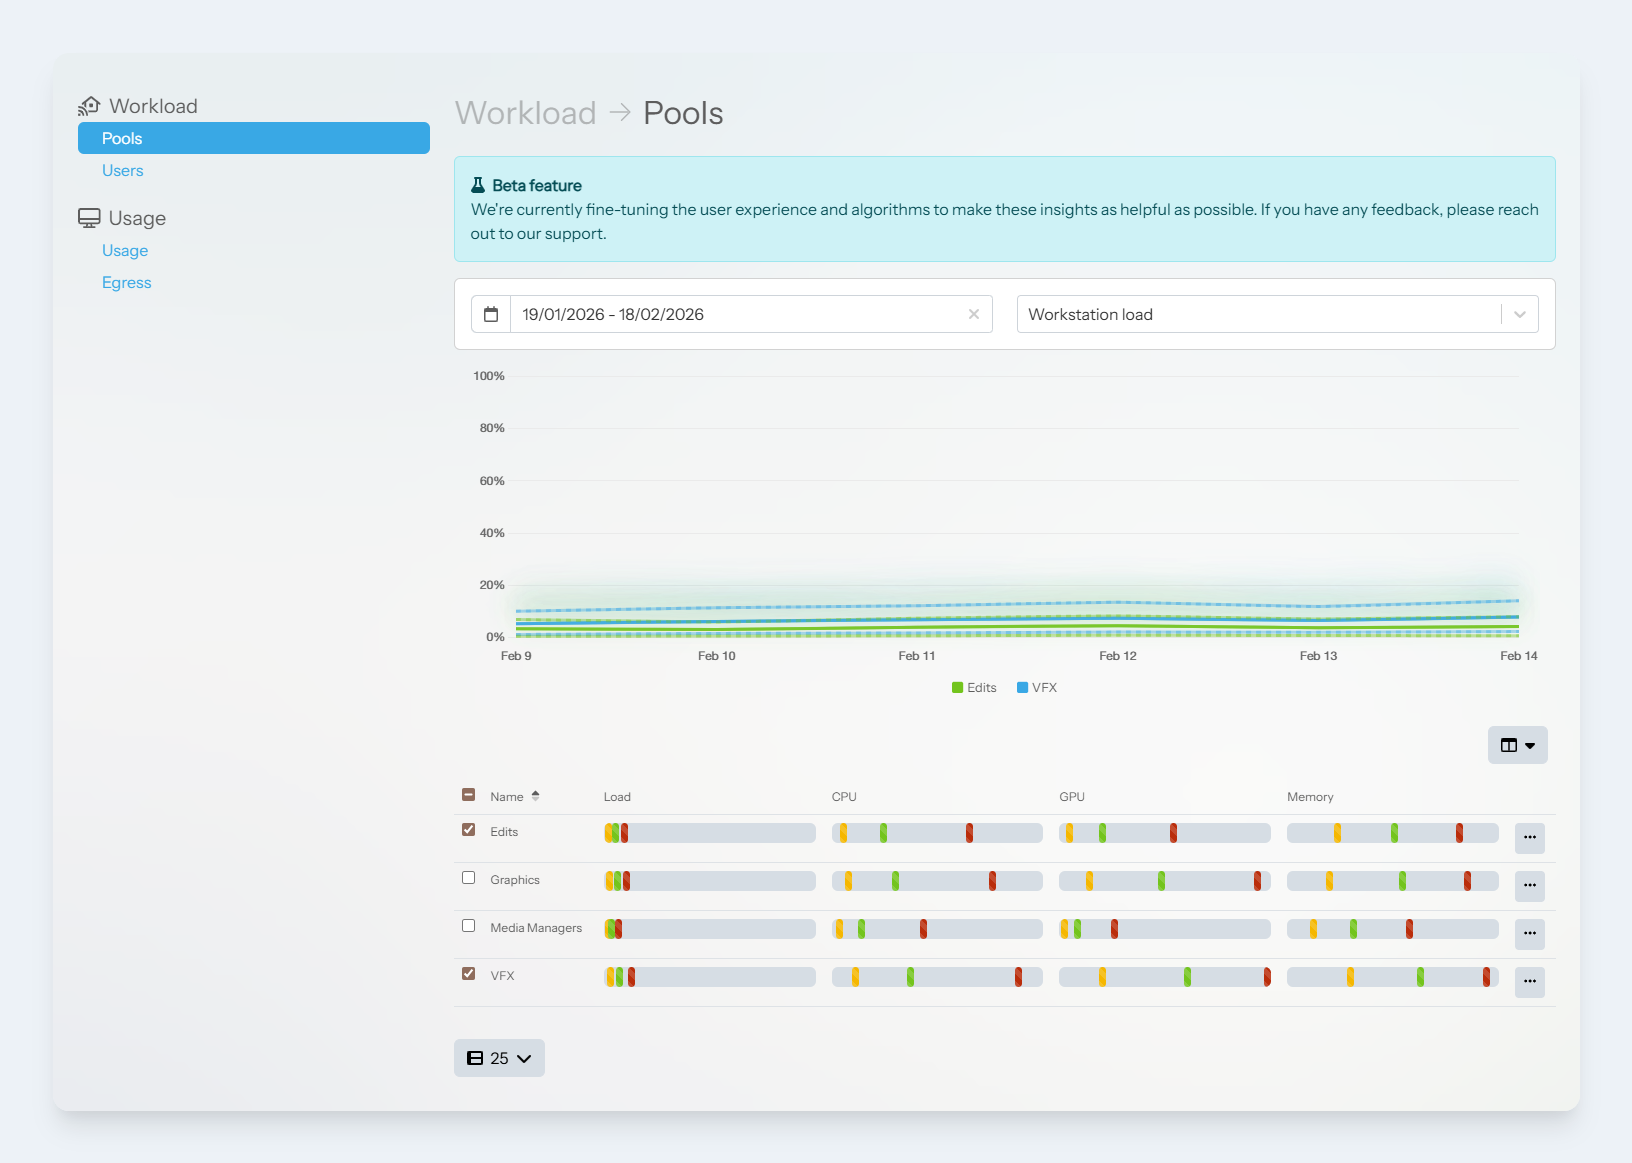
The pools view is the best place to get started with the Workload analyser. From this view, users can see how each pool is resourced. Selecting the checkbox next to each pool will add or remove it from the graph view.
The graph view shows how the resource usage changes over time, and provides three datasets: Minimum, Average and Maximum. Together with this data, administrators can build a clearer picture of how their workstations are being used.
To access the page:
-
Login to the Lens Portal
-
In the left sidebar, expand the
Insightsmenu and then select theWorkstationoption -
In the left panel under the
Workloadsection, select thePoolsoption
Understanding the data
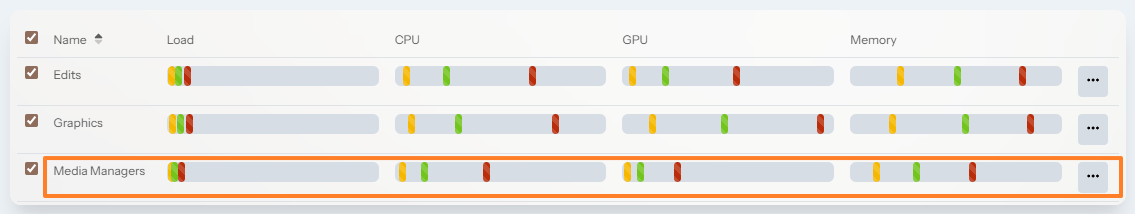
In the example above, we will look at how to read the Media Managers data. In the Load column, we can see that the minimum loads, average load and maximum loads are all at the very left most side of the load indicator. The left of the load indicator represents 0% utilisation, and the right side represents 100% utilisation. This tells us that the system is very likely over-resourced
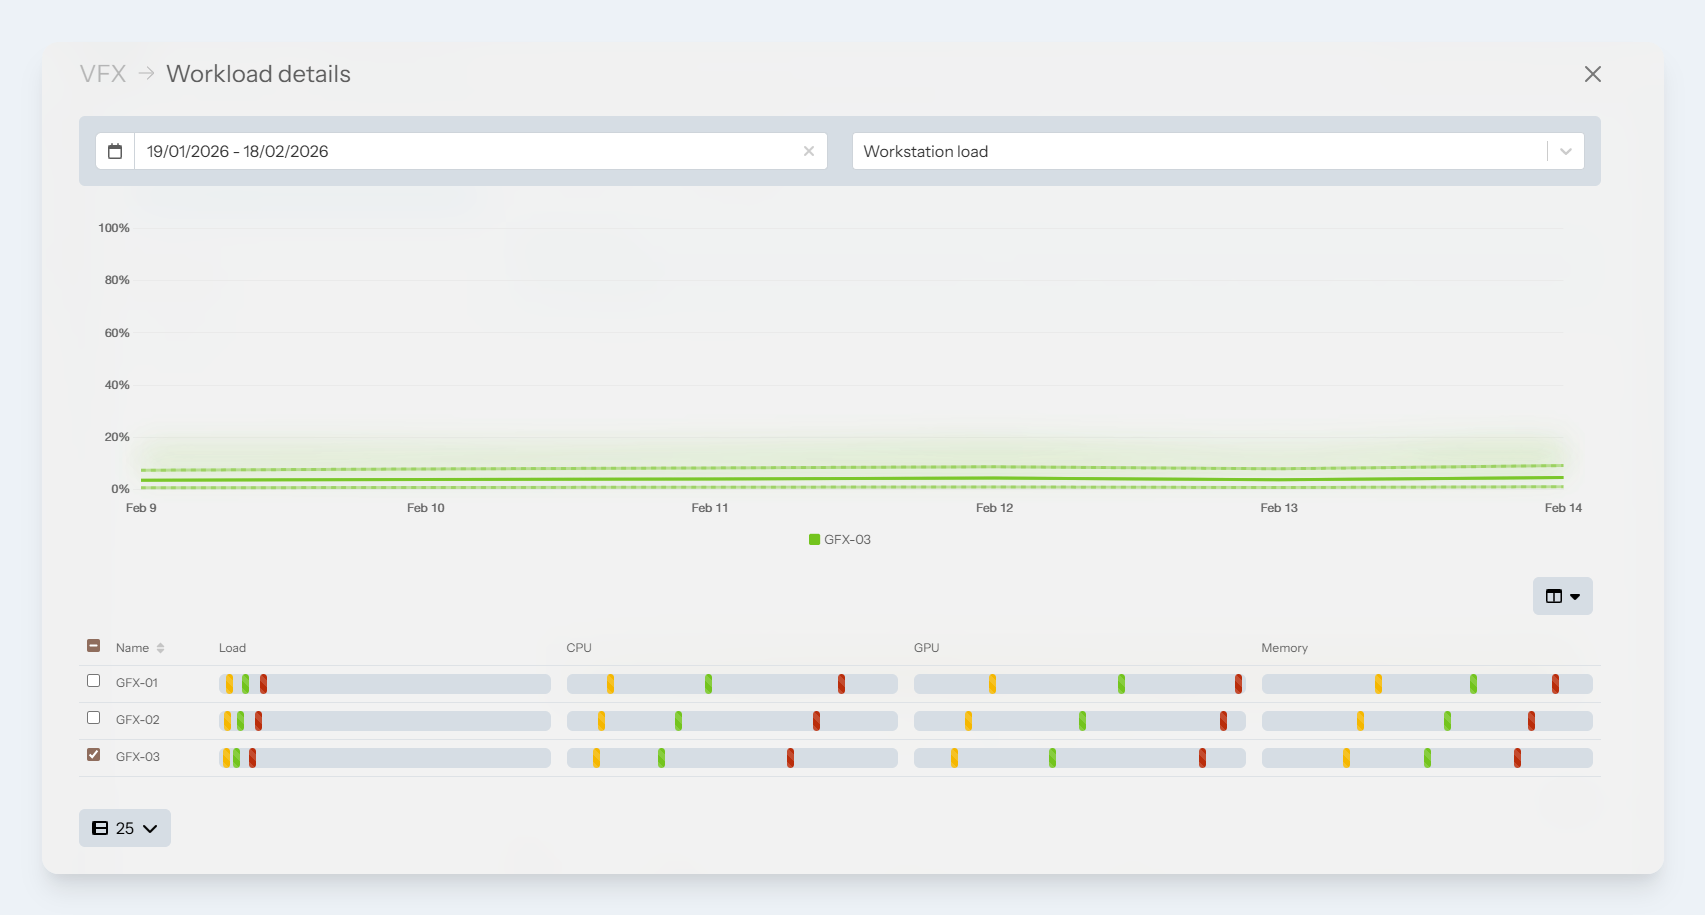
Individual workstation data
We can drill-down and view more details about the individual workstations that make up a pool.
-
From the Workload → Pools page, click the three-dot button next to your desired pool
-
A modal box will appear
-
Select the checkboxes next to the workstations you would like to add/remove from the graph