The Remote Edit Dashboard is aimed at providing clear information and simple controls for administrators. Sometimes administrators may wish to provide a self-service dashboard for remote edit users to be able to check if the system is ready for them to connect.
Assigning users or groups the Remote edit users role will give them access to a simplified dashboard showing them essential information and allowing them to test their connectivity to the system. See the Authentication page for more on how to set up Active Directory users. All other users can see this page by selecting the ‘Editor dashboard’ link from the System menu.
What does it show?
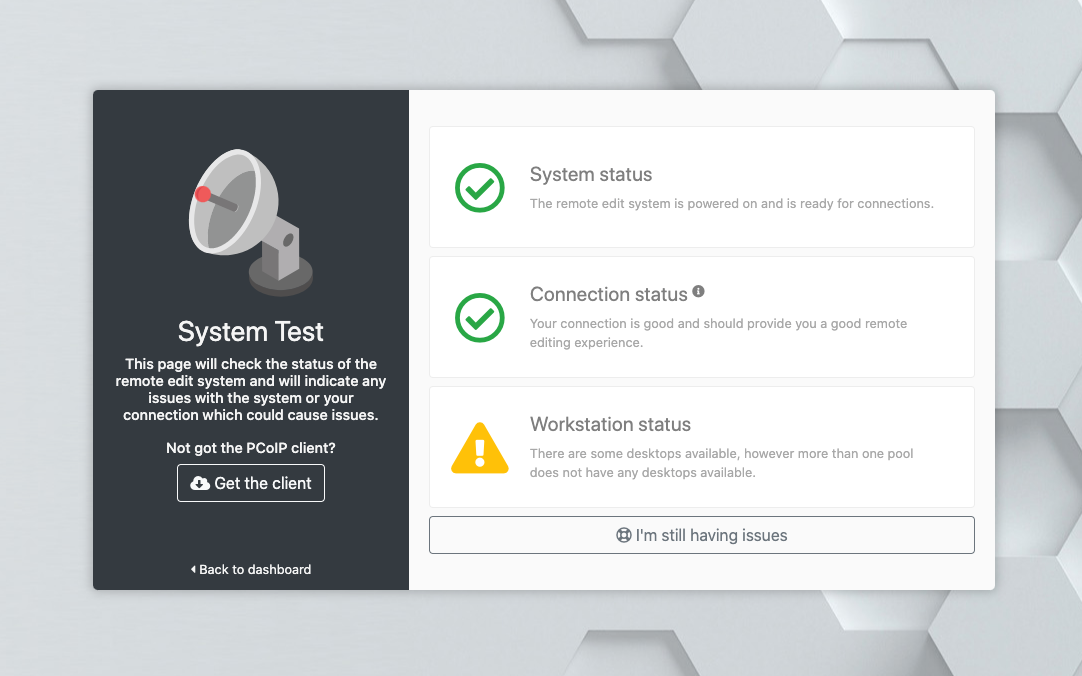
System status
This section shows the power status and overall health of the infrastructure. If any issues are found, users will be presented with a message outlining the general issue, enabling them to communicate this back to the system administrators.
Connection status
The connection status section performs a connection test in the background while users are on the page. The connection test provides the following information for users and administrators: download speed, upload speed, ping and jitter. These measurements are useful for establishing the quality of a user’s internet connection. The connection test is performed between the user’s desktop/client and the remote editing system, so the information gathered via this tool is more accurate than other external speed test tools. The user will be warned of any connectivity issues that are likely to impact the performance of the system.
Workstation status
The workstation status section informs users if there are desktops available for them to connect to. If a pool does not have any desktops available, then this section will illustrate this.